Cache blocking
If we run our latest version through perf stat -d, we will see that above a
certain problem size, it seems to be slowed down by memory access issues:
$ perf stat -d -- cargo bench --bench simulate -- --profile-time=10 1024x

    Finished `bench` profile [optimized + debuginfo] target(s) in 0.05s
     Running benches/simulate.rs (target/release/deps/simulate-f304f2306d63383e)
Gnuplot not found, using plotters backend
Benchmarking simulate/1024x1024: Complete (Analysis Disabled)


 Performance counter stats for 'cargo bench --bench simulate -- --profile-time=10 1024x':

         15 457,63 msec task-clock                       #    1,000 CPUs utilized
                45      context-switches                 #    2,911 /sec
                 0      cpu-migrations                   #    0,000 /sec
            16 173      page-faults                      #    1,046 K/sec
    66 043 605 917      cycles                           #    4,273 GHz                         (50,05%)
    32 277 621 790      instructions                     #    0,49  insn per cycle              (62,55%)
     1 590 473 709      branches                         #  102,892 M/sec                       (62,56%)
         4 078 658      branch-misses                    #    0,26% of all branches             (62,52%)
     6 694 606 694      L1-dcache-loads                  #  433,094 M/sec                       (62,50%)
     1 395 491 611      L1-dcache-load-misses            #   20,85% of all L1-dcache accesses   (62,46%)
       197 653 531      LLC-loads                        #   12,787 M/sec                       (49,97%)
         2 226 645      LLC-load-misses                  #    1,13% of all LL-cache accesses    (50,01%)

      15,458909585 seconds time elapsed

      15,411864000 seconds user
       0,047092000 seconds sys
Indeed, 20% of our data accesses miss the L1 data cache, and possibly as a result, the CPU only executes one SIMD instruction every two clock cycles. Can we improve upon this somehow?
Visualizing the problem
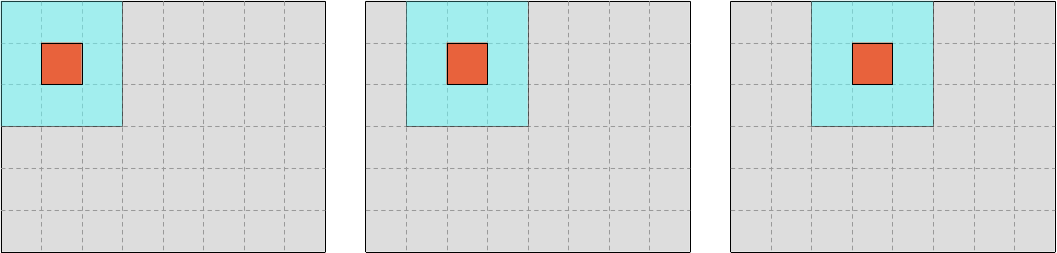
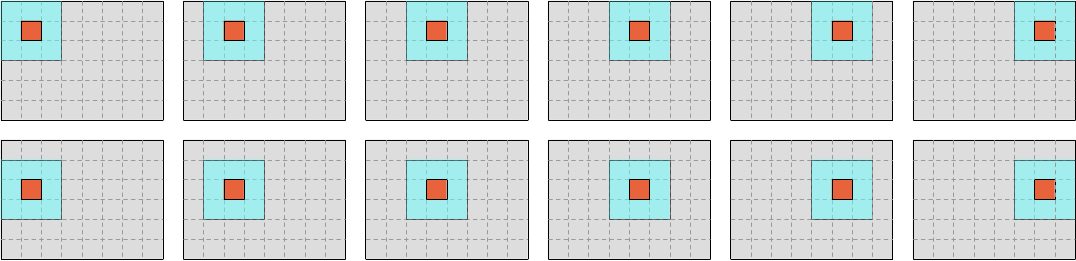
Recall that our memory access pattern during iteration looks like the following schematic, where the outer blue-colored square represents SIMD vectors that are being read and the inner red-colored square represents SIMD vectors that are being written:
There is, however, a more hardware-centered way to study this pattern, which is to investigate which SIMD vectors must be brought into the L1 CPU cache at each step of the computation, and which SIMD vectors can be reused from previous steps.
For simplicity, we will draw our schematics as if cache lines did not exist and CPUs truly loaded or stored one single SIMD vector whenever we ask them to do so.
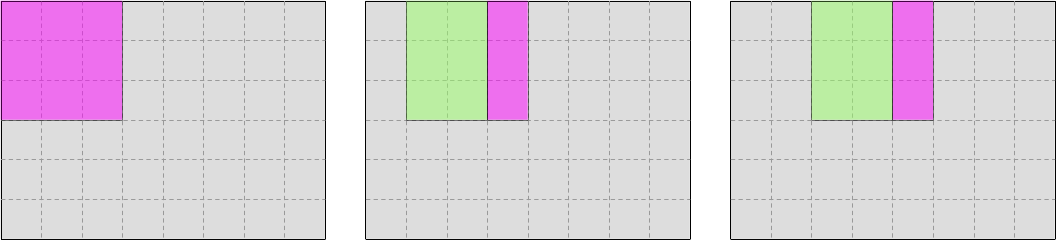
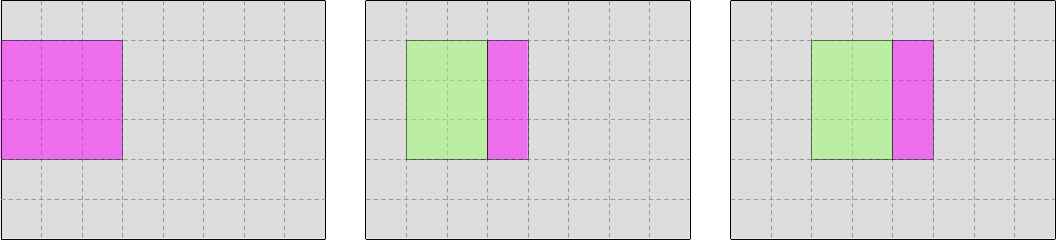
In the case of input data, the pattern looks like this, where pink represents data that is newly brought into the CPU cache, and green represents data that can be reused from previous iterations:
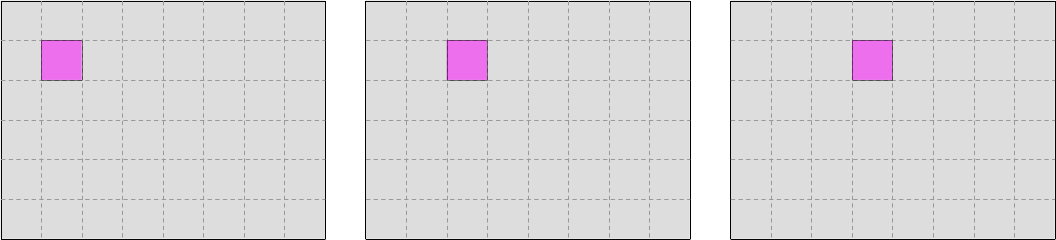
And in the case of output data, the pattern looks like this:
So far so good. As long as we are generating the first row of output data, there is no way to improve upon this pattern. The CPU cache is working as intended, speeding up at least 2/3 of our memory accesses, and it actually helps even more than this when more advanced cache features like hardware prefetching are taken into account.
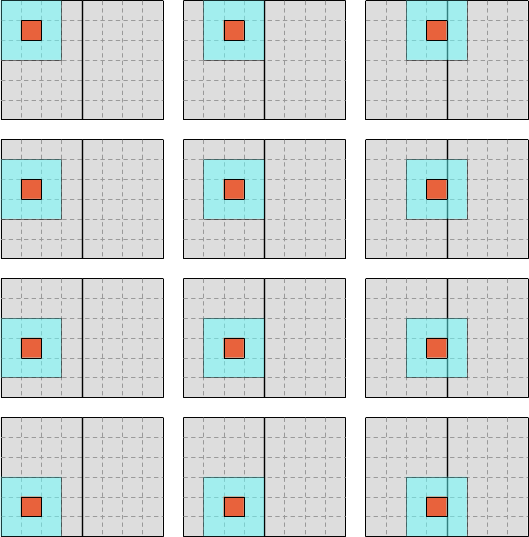
The question is, what will happen when we reach the second row of output data? Can we reuse the data that we loaded when processing the first row of data, like this?
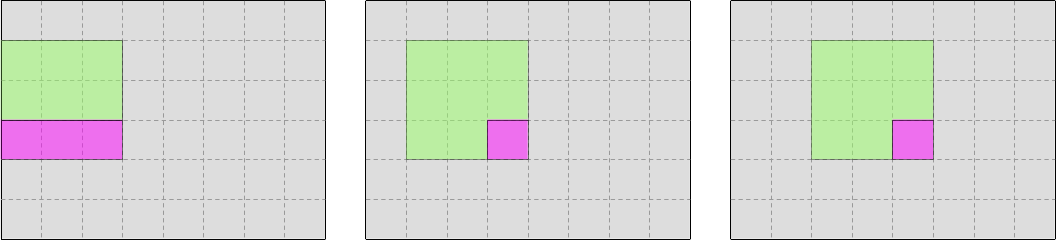
Or do we need to load everything again from RAM or a lower-level cache, like this?
The answer to this question actually depends on how many columns our simulation domain has:
- If the simulation domain has few columns, then by the time we start processing the second row of output, the input data will still be fresh in the L1 CPU cache and can efficiently be reused.
- But if the simulation domain has many columns, by the time we get to the second row, the input data from the beginning of the first row will have been silently dropped by the L1 CPU cache, and we will need to slowly reload it from RAM or a lower-level CPU cache.
We can estimate where the limit lies using relatively simple math:
- Let use denote
Sthe size of the L1 CPU cache in bytes andCthe width of the simulation domain in scalar columns. - In our optimized SIMD data layout, rows of data are padded by 1 SIMD vector of
zeros on both sides, so we actually have
K = C + 2 * Wscalar data columns in our internal tables, whereWis our SIMD vector width. - To produce a row of output, we must read
3 * Kdata points from the two input tables representing the starting concentrations of species U and V, and we must writeK - 2 * W = Cdata points to the two matching output tables. - Each data point is a number of type
Float, which is currently configured to be of typef32. Therefore, aFloatis currently 4 bytes. - So overall, the CPU cache footprint that is associated while reading input for
an entire row is
2 * (3 * K) * 4 = 24 * Kbytes and the CPU cache footprint that is associated with writing output for an entire row is2 * C * 4 = 8 * Cbytes. - By combining these two expressions, it follows that the total CPU cache
footprint associated with producing one row of output is
24 * K + 8 * Cbytes. Which, if we inject the value ofKinto the expression, translates into32 * C + 48 * Wbytes. - For optimal performance, we would like all this data to fit in L1 cache, so
that input data is still accessible by the time we start processing the second
row, knowing that we need some headroom for other things that go into the L1
cache like constant data. So overall we would like to have
32 * C + 48 * W < S. - And because we are actually interested in the maximal value of
C, we rewrite this expression into the mathematically equivalentC < (S - 48 * W) / 32.
By injecting concrete values of S and W into this expression, we get a
maximal value of C for which a given CPU can operate at optimal L1 cache
efficiency.
For example, if we consider an Intel i9-10900 CPU with 32 KiB of L1d cache and 256-bit AVX vectors, the limit of L1d cache capacity is reached when the simulation domain has around 976 columns (not accounting for other data which must fit in L1d cache). And unsurprisingly, this does indeed match the point where our microbenchmark’s performance drops.
So far so good, we have a theoretical model that is good enough to model the issue. Let us now use it to improve L1 cache hit rates at larger problem sizes!
The loop blocking trick
So far, we have used a simple iteration scheme where we fully iterate over each row of output concentrations, before moving to the next one:
It doesn’t have to be that way however. We could use a different scheme where we slice our data into a number of vertical blocks, and iterate over each vertical block before moving to the next one.
For example, we could first iterate over the left half of the data like this…
…and then iterate over the right half like this:
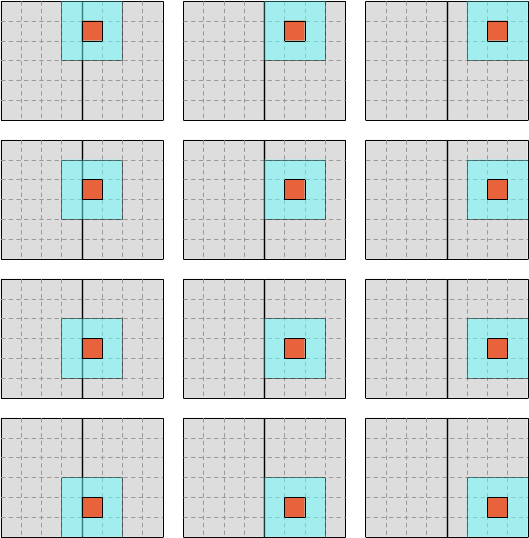
The computation is not sensitive to the order in which data points are computed, so this change of iteration order will not affect the results. What it will do, however, is to reduce the number of columns that are traversed before the computation moves to the next line, ideally ensuring that a large computation which did not fully leverage the CPU’s L1 cache before is now able to do so.
How wide should the blocks be? Well, there is a trade-off there. On one hand, CPUs work best when they are processing long, uninterrupted sequences of contiguous data, and from this perspective longer rows of data are better. On the other hand, the whole point of this chapter is to show you that long row lengths can be problematic for L1d cache locality. Taken together, these two statements entail that we should strive to make our blocks should as wide as available L1d cache capacity will allow, but no wider.
Which is where the simple theoretical model that we derived previously comes into play: using it, we will be able to determine how wide blocks could ideally be, assuming that the L1d cache were fully available for simulation data. We will then shrink this estimate using an empirically tuned safety factor in order to leave some L1d cache headroom for other program state (like constants) and CPU memory subsystem black magic like prefetches. And this is how we will get our optimal block width.
Determining the block width
Recall that our simple theoretical model gives us an C < (S - 48 * W) / 32
bound on block width, where S is the size of the L1d cache and W is our SIMD
vector width. We already have seen how one can query the SIMD vector width. But
where are we supposed to find out how large the L1d cache is, given that it
depends on your CPU, and sometimes even on the core where you are executing?1
In a C program, the easiest way to query the cache layout of your CPU would be
to use the excellent hwloc
library, which abstracts over hardware and OS specifics and gives you an easy
and portable way to query CPU topology information. But since we are doing Rust,
using hwloc directly will involve some unpleasant and unidiomatic unsafe
constructs.
Therefore, my recommendation will instead be for you to use
hwlocality, a safe binding
that I wrote on top of hwloc in order to make it easier to use from Rust.
We start by adding it to our project via a now familiar procedure…2
cargo add hwlocality
And then, inside of our code, we can easily use it to find the minimum L1d cache size across all available CPU cores:
use hwlocality::Topology;

let topology = Topology::new().expect("Failed to query hwloc topology");
let cache_stats = topology
    .cpu_cache_stats()
    .expect("Failed to probe CPU cache stats");
let l1d_size = cache_stats.smallest_data_cache_sizes()[0];
From this, we can deduce an upper bound on the optimal block width…
let l1d_size = smallest_l1d_cache_size();
let float_size = std::mem::size_of::<Float>();
let max_scalar_block_width = (l1d_size as usize - 12 * float_size * simd_width) / (8 * float_size);
…convert it to a number of SIMD vectors to account for our actual data layout…
let max_simd_block_width = max_scalar_block_width / simd_width;…and shrink it down by a safety factor (that we will late tune through microbenchmarking) in order to account for other uses of the L1d cache that our simple theoretical model does not cover:
// FIXME: Adjust this safety factor through microbenchmarking
let ideal_simd_block_width = (max_simd_block_width as f32 * 0.8) as usize
Putting it all together, we get this function:
/// Determine the optimal block size of the computation
pub fn simd_cols_per_block(simd_width: usize) -> usize {
    let topology = Topology::new().expect("Failed to query hwloc topology");
    let cache_stats = topology
        .cpu_cache_stats()
        .expect("Failed to probe CPU cache stats");
    let l1d_size = cache_stats.smallest_data_cache_sizes()[0];

    let float_size = std::mem::size_of::<Float>();
    let max_scalar_block_width =
        (l1d_size as usize - 12 * float_size * simd_width) / (8 * float_size);
    let max_simd_block_width = max_scalar_block_width / simd_width;

    // FIXME: Adjust this safety factor through microbenchmarking
    (max_simd_block_width as f32 * 0.8) as usize
}
One thing to bear in mind here is that although the code may look innocent
enough, computing the block size involves some relatively expensive operations
like querying the CPU’s memory subsystem topology from the OS. So we should not
do it on every call to the update() function. Instead, it should be computed
once during simulation initialization and kept around across update() calls.
Block-wise iteration
Now that we have a block size, let’s slice up our computation domain into actual blocks.
We start by adding a parameter to our update method so that the caller can pass in the precalculated chunk size.
pub fn update<const SIMD_WIDTH: usize>(
    opts: &UpdateOptions,
    start: &UV<SIMD_WIDTH>,
    end: &mut UV<SIMD_WIDTH>,
    cols_per_block: usize,  // <- This is new
) where
    LaneCount<SIMD_WIDTH>: SupportedLaneCount,
{
    // TODO: Implementation
}
Then we extract the center of the output array and we slice it up into non-overlapping chunks:
use ndarray::Axis;

let center_shape = end.simd_shape().map(|dim| dim - 2);
let center = s![1..=center_shape[0], 1..=center_shape[1]];
let mut end_u_center = end.u.slice_mut(center);
let mut end_v_center = end.v.slice_mut(center);
let end_u = end_u_center.axis_chunks_iter_mut(Axis(1), cols_per_block);
let end_v = end_v_center.axis_chunks_iter_mut(Axis(1), cols_per_block);
So far, ndarray makes life easy for us. But unfortunately, it does not have an
axis iterator that matches the semantics that we have for input windows, and
therefore we are going to need to hack it using careful indexing.
We start by iterating over output blocks, using enumerate() and a counter of
blocks to tell when we are going to reach the last block (which may be narrower
than the other blocks)..
let num_blocks = center_shape[1].div_ceil(cols_per_block);
for (idx, (end_u, end_v)) in end_u.zip(end_v).enumerate() {
    let is_last = idx == (num_blocks - 1);

    // TODO: Process one output block here
}
…and then we slice up input blocks of the right size:
use ndarray::Slice;

let input_base = idx * cols_per_block;
let input_slice = if is_last {
    Slice::from(input_base..)
} else {
    Slice::from(input_base..input_base + cols_per_block + 2)
};
let start_u = start.u.slice_axis(Axis(1), input_slice);
let start_v = start.v.slice_axis(Axis(1), input_slice);
At this point, we have correctly sized start_u, start_v, end_u and end_v
blocks. But our stencil_iter() function cannot accept them yet because the
code has so far been specialized to take full UV structs as input, and cannot
handle chunks of the simulation domain yet.
I will spare you the required code adjustments since the fine art of
generalizing unsafe Rust code without compromizing its safety is beyond
the scope of this short course. But in the end we get this:
use ndarray::ArrayViewMut2;

#[inline]
pub fn stencil_iter<'data, const SIMD_WIDTH: usize>(
    start_u: ArrayView2<'data, Vector<SIMD_WIDTH>>,
    start_v: ArrayView2<'data, Vector<SIMD_WIDTH>>,
    mut end_u_center: ArrayViewMut2<'data, Vector<SIMD_WIDTH>>,
    mut end_v_center: ArrayViewMut2<'data, Vector<SIMD_WIDTH>>,
) -> impl Iterator<
    Item = (
        ArrayView2<'data, Vector<SIMD_WIDTH>>, // <- Input u window
        ArrayView2<'data, Vector<SIMD_WIDTH>>, // <- Input v window
        &'data mut Vector<SIMD_WIDTH>,         // <- Output u
        &'data mut Vector<SIMD_WIDTH>,         // <- Output v
    ),
>
where
    LaneCount<SIMD_WIDTH>: SupportedLaneCount,
{
    // Assert that the sub-grids all have the expected memory layout.
    assert_eq!(start_u.shape(), start_v.shape());
    assert_eq!(end_u_center.shape(), end_v_center.shape());
    assert_eq!(start_u.shape().len(), 2);
    assert_eq!(end_u_center.shape().len(), 2);
    assert!(start_u
        .shape()
        .iter()
        .zip(end_u_center.shape())
        .all(|(start_dim, end_dim)| *start_dim == end_dim + 2));
    assert_eq!(start_u.strides(), start_v.strides());
    assert_eq!(start_u.strides(), end_u_center.strides());
    assert_eq!(start_u.strides(), end_v_center.strides());

    // Collect and check common layout information
    let in_shape = [start_u.shape()[0], start_u.shape()[1]];
    assert!(in_shape.into_iter().min().unwrap() >= 2);
    let strides = start_u.strides();
    assert_eq!(strides.len(), 2);
    assert!(strides.iter().all(|stride| *stride > 0));
    let [row_stride, col_stride] = [strides[0] as usize, strides[1] as usize];
    assert_eq!(col_stride, 1);
    let [out_rows, out_cols] = in_shape.map(|dim| dim - 2);

    // Determine how many elements we must skip in order to go from the
    // past-the-end element of one row to the first element of the next row.
    let next_row_step = row_stride - out_cols;

    // Prepare a way to access input windows and output refs by output position
    // The safety of the closures below is actually asserted on the caller's
    // side, but sadly unsafe closures aren't a thing in Rust yet.
    let stencil_shape = [STENCIL_WEIGHTS.len(), STENCIL_WEIGHTS[0].len()];
    let window_shape = (stencil_shape[0], stencil_shape[1]).strides((row_stride, 1));
    let unchecked_output = move |out_ptr: *mut Vector<SIMD_WIDTH>| unsafe { &mut *out_ptr };
    let unchecked_input_window = move |in_ptr: *const Vector<SIMD_WIDTH>| unsafe {
        ArrayView2::from_shape_ptr(window_shape, in_ptr)
    };

    // Recipe to emit the currently selected input windows and output references,
    // then move to the next column. As before, this is only safe if called with
    // correct element pointers.
    let emit_and_increment =
        move |in_u_ptr: &mut *const Vector<SIMD_WIDTH>,
              in_v_ptr: &mut *const Vector<SIMD_WIDTH>,
              out_u_ptr: &mut *mut Vector<SIMD_WIDTH>,
              out_v_ptr: &mut *mut Vector<SIMD_WIDTH>| unsafe {
            let win_u = unchecked_input_window(*in_u_ptr);
            let win_v = unchecked_input_window(*in_v_ptr);
            let out_u = unchecked_output(*out_u_ptr);
            let out_v = unchecked_output(*out_v_ptr);
            *in_u_ptr = in_u_ptr.add(1);
            *in_v_ptr = in_v_ptr.add(1);
            *out_u_ptr = out_u_ptr.add(1);
            *out_v_ptr = out_v_ptr.add(1);
            (win_u, win_v, out_u, out_v)
        };

    // Set up iteration state
    let mut in_u_ptr = start_u.as_ptr();
    let mut in_v_ptr = start_v.as_ptr();
    let mut out_u_ptr = end_u_center.as_mut_ptr();
    let mut out_v_ptr = end_v_center.as_mut_ptr();
    //
    // End of the current row processed by out_v_ptr
    let mut out_v_row_end = unsafe { out_v_ptr.add(out_cols) };
    //
    // End of the last row of the output grid
    let out_v_end = unsafe { out_v_row_end.add(out_rows.saturating_sub(1) * row_stride) };

    // Emit output iterator
    std::iter::from_fn(move || {
        // Common case : we are within the bounds of a row and advance normally
        if out_v_ptr < out_v_row_end {
            return Some(emit_and_increment(
                &mut in_u_ptr,
                &mut in_v_ptr,
                &mut out_u_ptr,
                &mut out_v_ptr,
            ));
        }

        // Otherwise, check if we reached the end of iteration
        if out_v_ptr == out_v_end {
            return None;
        }

        // We're at the end of a row, but not at the end of iteration:
        // switch to the next row then emit the next element as usual
        debug_assert_eq!(out_v_ptr, out_v_row_end);
        unsafe {
            in_u_ptr = in_u_ptr.add(next_row_step);
            in_v_ptr = in_v_ptr.add(next_row_step);
            out_u_ptr = out_u_ptr.add(next_row_step);
            out_v_ptr = out_v_ptr.add(next_row_step);
            out_v_row_end = out_v_ptr.add(out_cols);
        }
        Some(emit_and_increment(
            &mut in_u_ptr,
            &mut in_v_ptr,
            &mut out_u_ptr,
            &mut out_v_ptr,
        ))
    })
}
Basically, where we used to slice the center of the output ourselves, the caller is now responsible for doing it, and the rest is similar as slicing an N-d array does not affect the memory stride from one row to the next, which is the main low-level layout information that we rely on here.
Exercise
Integrate this loop blocking optimization into the code. Note that this will
require some changes to the run_simulation function.
Then microbenchmark the code, and adjust the security factor in the
implementation of simd_cols_per_block to see how it affects
performance. The results may surprise you!3
As seen in power efficiency focused CPUs like Arm big.LITTLE and Intel Adler Lake.
Before it works, however, you will need to also ensure that your Linux
distribution’s equivalent of Ubuntu and Debian’s libhwloc-dev package is
installed. Unfortunately, C dependency management is not quite at the same
level of convenience as Rust’s cargo add…
…and in fact, I am still suspicious of them myself, and would like to spend more time analyzing them later on. Something for a future edition of this school?